
Retrofitting Retrofitting
30 Nov 2015For my recent qualifying exam, I had to select 2 papers from a list of about 10 papers collected by the faculty. I was pleased to see that Retrofitting Word Vectors to Semantic Lexicons by Manaal Faruqui et. al. was one of the choices, and chose it. It was published in NAACL 2015, where it won the best student paper award.
In preparation for the qual, I studied the paper carefully, and I wanted to share some thoughts and experiments here.
Capitalization
I tried to recreate the experiment using PPDB and the skip-gram (word2vec). The PPDB file came with the code, and the word2vec file came from the website. The code was easy to run, fast, and bug-free, but I kept getting ridiculously low numbers. Perhaps I had the wrong data?
To check this, I used the filtered word2vec data they had used in the experiments (Manaal sent this to me). I’m not sure how the filtering happened, but you don’t need all 3 million words to do the retrofitting experiments. Everything checked out, and produced the reported scores exactly. So what’s the story?
After poking around, I found that the issue was capitalization. The word2vec corpus contains words capitalized, uncapitalized, and somewhere in between (i.e. Abc, abc, ABC), but the filtered data contained only lower-case words. But as it turns out, the word vectors for ABC and Abc are not the same.
I confirmed this by doing my own filtering of the word2vec data. When I had a choice of word (Abc or abc), I would select the version with the smallest cosine distance from the word in the filtered data. This gave me identical results (row 2 in the table). Good.
So how was the filtering done? It seemed to be with haphazard capitalization – sometimes a capitalized word, sometimes a lower-case word. This begged the question: what if we are systematic about this? I did some experiments. Whenever I had a choice of words, I would sort them by capitalization, and select from this list. If I choose the capitalized versions, this is “Sort by most caps, pick the first” in the table. This gets terrible results (similar to what I had been getting from the entire dataset). If I choose the lowercased version, this is “Sort by fewest caps, pick the first”, and does very well. In fact, this does better than the reported results in the paper. In the case of MEN-3k, it does significantly better. Finally, if I average all the vectors, this is the last row. This is still better than the reported results, but not as good as lower-cased.
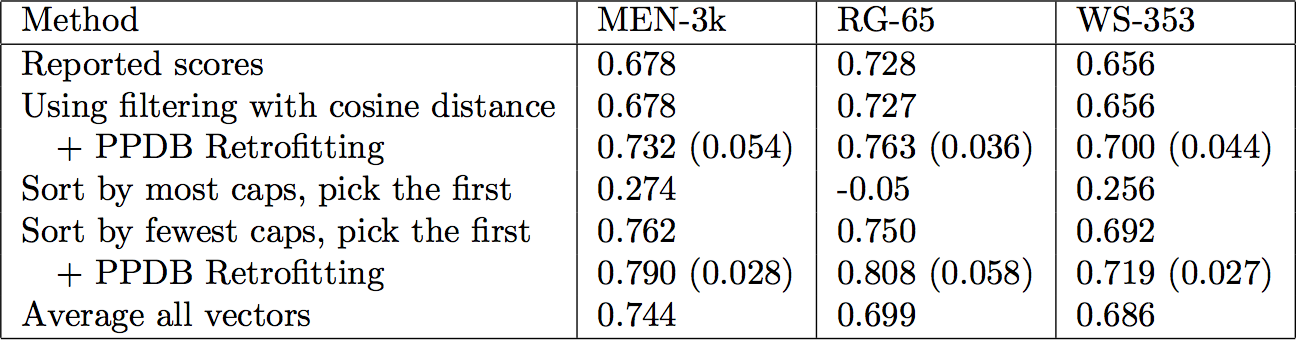
The intuition behind this is straightforward: a word is capitalized when it is at the beginning of a sentence, which is much rarer than being in the middle of a sentence (especially with sentences as long as this one). Thus, capitalized words have less training data.
Training Data Size
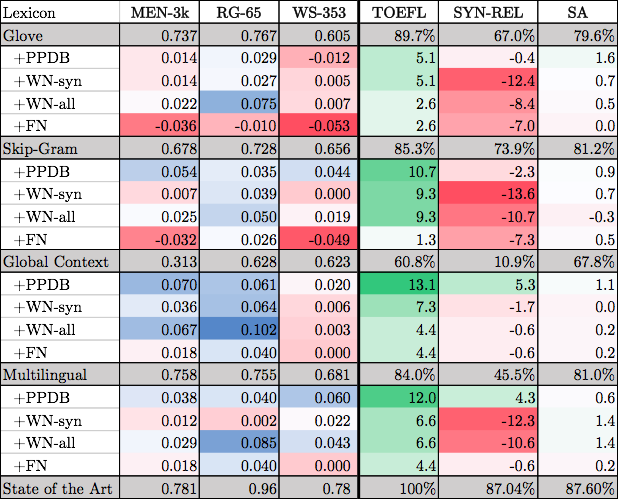
This brings up the next point. How important is the size of the training data? In Table 2, the skip-gram embeddings are trained on the Google News corpus of 100 billion words. Now compare this with the results shown in the bottom half of Table 4, where they compare with Xu et. al. The evaluations and the algorithms are the same; the only difference is the training data for the word vectors, which is 120 million words of Wikipedia (details here), an order of magnitude less than the available skip-gram vectors.
There are several odd things here. First, independently of the retrofitting procedure, the SG scores are much different from Table 2. In particular, MEN-3k is 9 points better, and SYN-REL is 40 here compared to 73 previously. Then, retrofitting seems to hurt the results in many cases. Why is this? Also, retrofitting helps in the SYN-REL task, even though the earlier hypothesis is that semantic retrofitting will not help a strictly syntactic task. One explanation for this last one is that the bare word vectors are doing so badly that the syntactic edges that do make it into PPDB have a big effect (I don’t know how many edges this is – presumably not many?).
Assorted thoughts.
An obvious point: retrofitting doesn’t change word vectors that are not in the lexicon. It’s obvious, but it’s not explicit in the paper, and could be missed. This brings up the importance of lexicon coverage, which I’ll mention later.
A minor quibble: the correlation scores are multiplied by 100 to make them look more compatible with percent values. I found this a little misleading – correlation ranges from -1 to 1, and so a percentage interpretation makes no sense. I re-decimaled the table, and added color to make it a little easier to read.
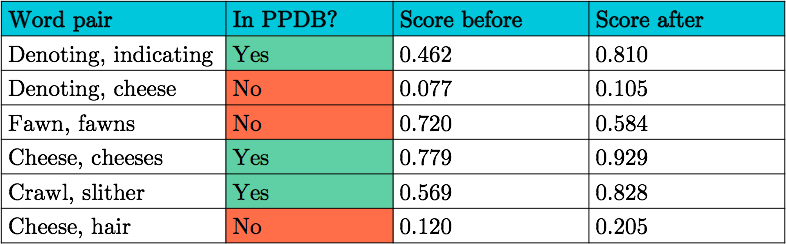
A question for future work: what is the importance of coverage in the lexicon? For example, “fawn” and “fawns” have a similarity score of 0.720 before retrofitting, and 0.584 after. This is because PPDB doesn’t have this link. In contrast, “cheese” and “cheeses” is in PPDB, and the before/after scores are 0.779, 0.929. With a poorly chosen lexicon, it is possible that retrofitting does more harm than good.
On the whole, I’m very much in favor of the battery of tests. I love to see that the algorithm has been tested widely. That said, I’m not sure that RG-65 or the TOEFL test should be given much weight. The former is tiny, the latter is solved. It’s interesting to see how retrofitting performs, but I’m not sure we can form any solid conclusions from results on either one.
Many thanks to Manaal for being responsive and helpful, and for providing code and data. If only all projects were this well organized and easily reproducible (footnote: I know the code is simple, and uses off the shelf data, but still it was a delight to work with).